Benchmarks
Benchmarks
Benchmarks
Benchmarks
Benchmarks
Benchmarks
The Centre for Water Systems hosts a number of benchmark problems used in the urban water modelling and optimisation literature. The current benchmarks include examples of water distribution networks used by various researchers in their studies. Some of them have been around since the 1960's (e.g. The New York Tunnels problem). We have tried to include the basic information about each of the problems, the simulation input file (e.g., EPANET files for water distribution systems) and any other information we found useful in analyzing these problems.
The following categories of benchmark problems are included: Expansion | Layout | Operation | Design/Resilience
Colorado Springs Utilities, currently serves a population of about 370,000 persons with the population projected to increase to about 520,000 persons by year 2030.
Several master planned developments within the City require system optimization to determine the best engineering solution in meeting established design criteria while at the same time minimizing capital costs. A hydraulic water model in conjunction with WinPipes was used to optimize the water system design for a small development and a large development. The area of the small development, the Wolf-Codera Ranch (WCR), is 2,400 acres with an estimated average daily demand of 3.7 million gallons per day.
Water service to WCR is provided from a 10 MGD pump station which pumps to a 5 MG reservoir.
Wolf-Cordera Ranch Model
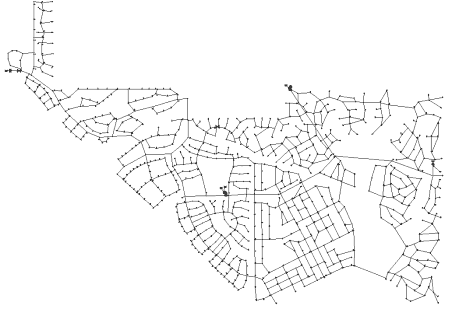
The area of the small WCR development is 2,400 acres with an estimated average daily demand of 3.7 million gallons per day WCR model contains1981 pipes, 372 hydrants and 5 pumps. The pipe to area ratio is 0.825 pipes per acre. The system consists mostly of 8-inch diameter pipes. The system has to provide multiple large fire demands of 5250 gpm to 8000 gpm by simultaneous opening of multiple hydrants and residential fire demands of 2500 gpm to 2750 gpm.
Wolf-Cordera Ranch Multi-Objective Optimization
Multi-objective optimization may be used to meet all design criteria while satisfying all physical constraints. These include, at a minimum, node pressures, fire flows and system performance with any one of the critical components out of service. The WCR water system was evaluated for pressure at 544 nodes, fire flow at 544 hydrants, simultaneous fire flow for 33 commercial locations and 45 residential locations, pump discharge capacity and energy life cycle costs for average day and maximum day demands. The initial 625 objective evaluations were reduced to 40 objective evaluations by eliminating hydrants that were found to meet design criteria with minimum pipe sizes.
Related input files
Original EPANet Input Files: Wolf-Cordera Initial Model .
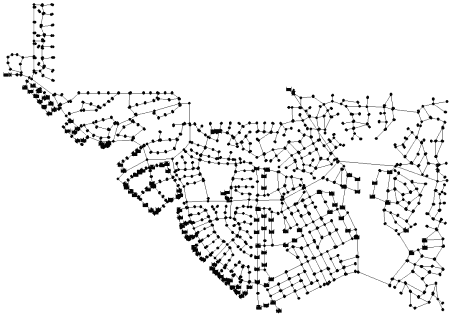
Modified EPANet Input Files: Wolf-Cordera Modified Model .
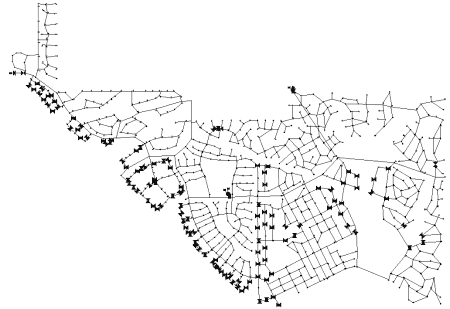
EPANet Output Files: Wolf-Cordera Output Model .
A modified form of the Wolf-Cordera Ranch excel file is used for optimization is also included. It contains the variables, constraints and objectives.
The Excel file has been scanned for viruses, however, this file contains macros and no guarantee as to the correct execution or virus-free nature of this file is implied or guaranteed by the Centre for Water Systems or the University of Exeter.
The Excel file needs to be opened by first opening Excel and going to the directory where the file is.
- Almos-Pipe diameters - variables
- CT - Pipe cost
- R - Pressure constraints - objectives
- M - Demand adjustments
- C - Pipe closures for reliability - objectives
- K - Tank elevations - variables
- F - Fire flow demands - objectives
- S - Simultaneous fire flow - objectives
- MX - Maximum pressure and velocity constraint
- K - Link closures and settings - variables
Bocika INP . and Bocika MAP . are output EPANET1 files that can be run to observe system response to fire flow, ...
Publications
- Lippai, I. (2005) Colorado Springs Utilities Case Study: Water System Calibration/Optimization. ASCE Pipeline Conference, August
- Lippai, I. And Wright, L. (2005) Criticality Analysis Case Study: Zone 7 Water Distribution System. ASCE Pipeline Conference, August
- Lippai, I. (2005) Water System Design by Optimization: Colorado Springs Utilities Case Studies. ASCE Pipeline Conference, August
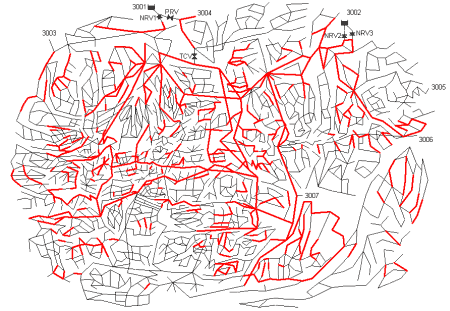
This benchmark water system has been set up by the Centre for Water Systems of Exeter University as a realistic challenging problem. The aim is to determine the most economically effective design to reinforce the existing system to meet projected demands as a network. The network serves a population of approximately 400,000. It consists of relatively small pipes and few transmission mains, with a large head-loss range at the extremities of the system, making it highly sensitive to demand increases.
In order to continue to provide water to customers at the highest level, a reinforcement scheme for the network using demands projected to the year 2020 is considered to avoid low pressure problems in the future. This expansion plan is based on a calibrated model of the network with a minimum pressure requirement of 20.0m at demand nodes. The following table summarizes available discrete pipe diameters and their corresponding Colebrook-White friction factors. The unit costs for pipe laying which are function of pipe diameter and type of roads, in major roads excavations are more difficult to undertake and consequently more expensive, are given in table.
Pipe Rehabilitation Alternative Costs
| Internal Pipe Diameter (mm) | Colebrook-White Friction Factors (mm) | Unit cost ($/m) | |
|---|---|---|---|
| Minor Road/Footpath | Major Road | ||
| 110 | 0.03 | 85 | 100 |
| 159 | 0.065 | 95 | 120 |
| 200 | 0.1 | 115 | 140 |
| 250 | 0.13 | 150 | 190 |
| 300 | 0.17 | 200 | 240 |
| 400 | 0.23 | 250 | 290 |
| 500 | 0.3 | 310 | 340 |
| 600 | 0.35 | 370 | 410 |
| 750 | 0.43 | 450 | 500 |
| 900 | 0.5 | 580 | 625 |
The full information regarding the network and the optimization problem is available from following two papers.
- Farmani R., Savic D.A. and Walters G.A. (2004) Evolutionary Multi-Objective Optimization in Water Distribution Network Design, Engineering Optimization, submitted for publication.
- Farmani R., Savic D.A. and Walters G.A. (2004) "EXNET" Benchmark Problem for Multi-Objective Optimization of Large Water Systems. Modelling and Control for Participatory Planning and Managing Water Systems, IFAC workshop, Venice, Italy, 29 Sept.- 1 Oct., 2004
The input file of the network is available in EPANET network solver format.
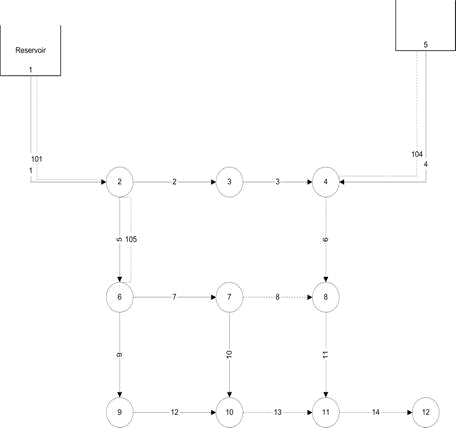
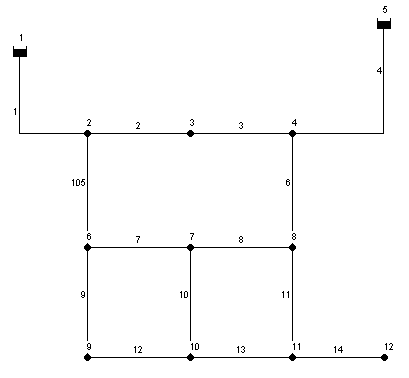
This pipe network has been studied by Gessler 1985 and Simpson et al. 1994. The objective of the problem is to determine the most economically effective design for addition of five new pipes (6, 8, 11, 13 and 14) to the existing system, and duplication or cleaning or leaving alone three of the existing pipes (1, 4 and 5). There are three demand patterns that must be satisfied and two supply sources are available.
| Node | Demand Pattern 1 | Demand Pattern 2 | Demand Pattern 3 | |||
|---|---|---|---|---|---|---|
| Demand (l/s) | Minimum pressure head (m) | Demand (l/s) | Minimum pressure head (m) | Demand (l/s) | Minimum pressure head (m) | |
| 2 | 12.62 | 28.18 | 12.62 | 14.09 | 12.62 | 14.09 |
| 3 | 12.62 | 17.61 | 12.62 | 14.09 | 12.62 | 14.09 |
| 4 | 0 | 17.61 | 0 | 14.09 | 0 | 14.09 |
| 6 | 18.93 | 35.22 | 18.93 | 14.09 | 18.93 | 14.09 |
| 7 | 18.93 | 35.22 | 82.03 | 10.57 | 18.93 | 14.09 |
| 8 | 18.93 | 35.22 | 18.93 | 14.09 | 18.93 | 14.09 |
| 9 | 12.62 | 35.22 | 12.62 | 14.09 | 12.62 | 14.09 |
| 10 | 18.93 | 35.22 | 18.93 | 14.09 | 18.93 | 14.09 |
| 11 | 18.93 | 35.22 | 18.93 | 14.09 | 18.93 | 14.09 |
| 12 | 12.62 | 35.22 | 12.62 | 14.09 | 50.48 | 10.57 |
The node and link data are from Simpson et al. (1994). Hazen-Williams roughness coefficient for new pipes and cleaned pipes is equal to 120. In the following figure the solid lines represent the existing system and the dashed lines depict the new pipes.
There are 8 available discrete diameters [152, 203, 254, 305, 356, 407, 458, 509 mm].
The unit costs for pipe laying, cleaning and lining are given in the following table:
| Diameter(mm) | Cost of new pipe ($/m) | Cost of cleaning existing pipe($/m) |
|---|---|---|
| 152 | 49.54 | 47.57 |
| 203 | 63.32 | 51.51 |
| 254 | 94.82 | 55.12 |
| 305 | 132.87 | 58.07 |
| 356 | 170.93 | 60.7 |
| 407 | 194.88 | 63.0 |
| 458 | 232.94 | - |
| 509 | 264.1 | - |
The input file of the network is available in Epanet network solver format.
Expansions of existing water distribution systems
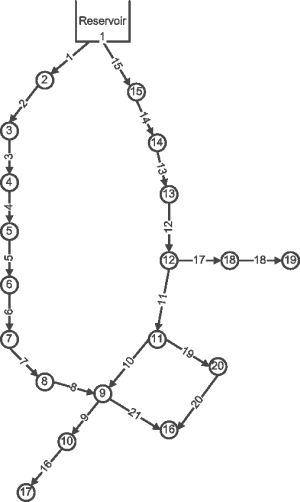
The objective of the New York Tunnel (NYT) problem is to determine the most economically effective design for addition to the existing system of tunnels that constituted the primary water distribution system of the city of New York.
All twenty-one pipes are considered for duplication. There are 15 available discrete pipe diameters [36, 48, 60, 72, 84, 96, 108, 120, 132, 144, 156, 168, 180, 192, 204 inches] and one extra possible decision which is the ?do nothing? option. The minimum head requirement at all nodes is fixed at 255 ft except for node 16, 17 and 1 that are 260, 272.8 and 300 ft respectively.
The cost function is non-linear:

where
C is cost in dollars,
D is diameter in inches,
and L is length in feet.
The input file of the network is available in Epanet network solver format.
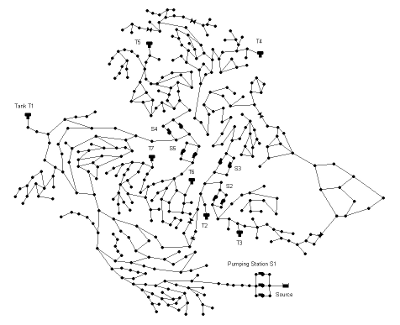
The objective of the D-Town network problem is to determine the best long-term design improvements given projected future water demand and development of a new area. This analysis takes into account capital and operational costs, greenhouse gas (GHG) emissions and water age.
The D-Town network consists of five existing district metered areas (DMAs) requiring upgrades and an additional new zone to be designed. In total, The D-Town network consists of 399 junctions, 7 storage tanks, 443 pipes, 11 pumps and 5 valves, and a single reservoir.
The D-Town full problem description pdf document and D-Town input file can also be obtained from the BWN-II web page.
 |
BWN-II Competition Solutions
The Battle of the Water Networks II (BWN-II) was a competion that involved teams from academia, consulting firms, and utilities from around the world to propose a design methodology and apply it to the D-Town network problem. The results of the BWN-II competition were presented at a special session of the 14th Water Distribution Systems Analysis Symposium. The following paper summarizes the approaches used by the participants and the results they obtained:
This BWN-II competition networks zip file contains all the final network input files and support files submitted by the participants of the competitions. Please note that the objective values in the Excel files are the ones computed by the partecipants and not the ones used by the committees for the final result of the competition.
Reference set
This D-Town reference set file contains the objective values of the non-dominated feasible solutions from the following sources:
- Guidolin M., Fu G., and Reed P. (2012). “Parallel evolutionary multiobjective optimization of water distribution system design.” Proceedings of the 14th waterdistribution systems analysis symposium, Engineers Australia, Adelaide, Australia.
Please note that the objective values are the ones computed by the authors of the paper and not the ones used by the committees for the final result of the competition.
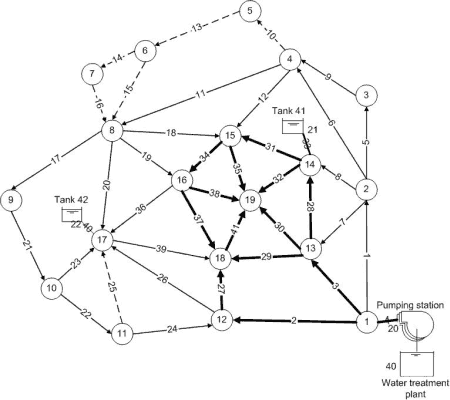
The objective of the Anytown network problem is to determine the most economically effective design to reinforce the existing system to meet projected demands, taking into account pumping costs as well as capital expenditure. The town is formed around an old centre situated to the south east of pipe 34, where excavations are more difficult to undertake and consequently are more expensive. There is a surrounding residential area, with some existing industries near node 17 and a projected new industrial park to be developed to the north. Options include duplication (in a range of possible diameters) of any pipe in the system, addition of new pipes, selecting the operation schedule of pumping stations and provision of new reservoir storage at any location. Water is pumped into the system from a water treatment works by means of three identical pumps connected in parallel. The link and node data are available from input file . The US customary units have been used in this study.
The water in the treatment works is maintained at a fixed level of 10 ft. The average daily water use at each node for year 2005 as well as the elevation of the nodes and the bottoms of the tanks are given in input file . The variation in water use throughout the day are also summarized in input file.
The two existing tanks are operated with water levels between elevations 225 ft and 250 ft, giving an effective capacity of 156250 gal(US) for each tank. The volume of water below the level 225 ft and above 215 ft is retained for emergency needs, giving an emergency volume of 62500 gal(US) for each tank. A minimum pressure of at least 40 psi must be provided at all nodes at average day flow as well as instantaneous peak flow, which is 1.8 times the average day flow. All tanks should empty and fill over their operational ranges during the specified average demand day. The system is also subject to 3 fire flow conditions under which it must supply water at a minimum pressure of at least 20 psi. Details of 5different loading conditions are available from loading condition table. The fire flow duration is two hours with tanks starting at their low operating levels and one pump being out of service, and must be met while also supplying peak day flows, which are 1.3 times average day flow. It is assumed that during fire flow periods only the flow required for fires is supplied at the corresponding nodes.
Loading conditions
| NodeID | Elevation (ft) | Average day demand (gpm) | Instantaneous peak (gpm) | Fire 1 (gpm) | Fire 2 (gpm) | Fire 3 (gpm) |
|---|---|---|---|---|---|---|
| 1 | 20 | 500 | 900 | 650 | 650 | 650 |
| 2 | 50 | 200 | 360 | 260 | 260 | 260 |
| 3 | 50 | 200 | 360 | 260 | 260 | 260 |
| 4 | 50 | 600 | 1080 | 780 | 780 | 780 |
| 5 | 80 | 600 | 1080 | 780 | 1500 | 780 |
| 6 | 80 | 600 | 1080 | 780 | 1500 | 780 |
| 7 | 80 | 600 | 1080 | 780 | 1500 | 780 |
| 8 | 80 | 400 | 720 | 520 | 520 | 520 |
| 9 | 120 | 400 | 720 | 520 | 520 | 520 |
| 10 | 120 | 400 | 720 | 520 | 520 | 520 |
| 11 | 120 | 400 | 720 | 520 | 520 | 1000 |
| 12 | 50 | 500 | 900 | 650 | 650 | 650 |
| 13 | 50 | 500 | 900 | 650 | 650 | 650 |
| 14 | 50 | 500 | 900 | 650 | 650 | 650 |
| 15 | 50 | 500 | 900 | 650 | 650 | 650 |
| 16 | 120 | 400 | 720 | 520 | 520 | 520 |
| 17 | 120 | 1000 | 1800 | 1300 | 1300 | 1000 |
| 18 | 50 | 500 | 900 | 650 | 650 | 650 |
| 19 | 50 | 1000 | 1800 | 2500 | 1300 | 1300 |
35 existing pipes are considered for duplication or cleaning and lining. There are 6 additional new pipes. The range of each type of variable as well as the unit costs for pipe laying, cleaning and lining are given in the following Table. A pipe which has been cleaned and lined has a Hazen-Williams coefficient of C=125 and for new pipes C=130.
Pipe rehabilitation alternative costs
| Pipe diameter (in) | New pipes ($/ft) | Duplicating existing pipes ($/ft) | Clean and line existing pipes ($/ft) | ||
|---|---|---|---|---|---|
| City | Residential | City | Residential | ||
| 6 | 12.8 | 26.2 | 14.2 | 17.0 | 12.0 |
| 8 | 17.8 | 27.8 | 19.8 | 17.0 | 12.0 |
| 10 | 22.5 | 34.1 | 25.1 | 17.0 | 12.0 |
| 12 | 29.2 | 41.4 | 32.4 | 17.0 | 13.0 |
| 14 | 36.2 | 50.2 | 40.2 | 18.2 | 14.2 |
| 16 | 43.6 | 58.5 | 48.5 | 19.8 | 15.5 |
| 18 | 51.5 | 66.2 | 57.2 | 21.6 | 17.1 |
| 20 | 60.1 | 76.8 | 66.8 | 23.5 | 20.2 |
| 24 | 77.0 | 109.2 | 85.5 | 30.1 | - |
| 30 | 105.5 | 142.5 | 116.1 | 41.3 | - |
Given a 24 hour operation cycle and 1 hour time step, the control variables for the three pumps give a further 24 design variable which is the number of pumps in operation during each hour. Following table gives five points on the characteristic curve for the pumps, together with the corresponding wire-to-water efficiencies. Pump station operating costs are based on a unit cost for energy, constant throughout the 24 hours, equal to $0.12/kWh. The present worth of energy costs are based on an interest rate of 12% and an amortization period of 20 years.
Pump characteristics
| Discharge (gpm) | Pump head (ft) | Efficiency (%) (wire to water) |
|---|---|---|
| 0 | 300 | 0 |
| 2000 | 292 | 50 |
| 4000 | 270 | 65 |
| 6000 | 230 | 55 |
| 8000 | 181 | 40 |
All nodes are considered as potential sites for new tanks, except those which are already connected directly to the existing tanks. Tanks are connected to a node by a short pipe, known as a riser, of known length (101 ft) but of variable diameter. Tank costs are considered as a function of volume and are given in the following table. Intermediate tank sizes are considered in the proposed methods and the corresponding costs are determined linearly according to the standard sizes and costs.
Tank costs
| Tank volume (gal) | Cost ($) |
|---|---|
| 50000 | 115000 |
| 100000 | 145000 |
| 250000 | 325000 |
| 500000 | 425000 |
| 1000000 | 600000 |
References
- Walski, T. M., Brill, E. D., Gessler, J., Goulter, I. C., Jeppson, R. M., Lansey, K., Han-Lin Lee, Liebman, J. C., Mays, L., Morgan, D. R., and Ormsbee, L. (1987). Battle of the network models:epilogue. Journal of Water Resources Planning and Management, ASCE, 113(2), 191-203.
- Walters, G. A., Halhal, D., Savic, D., and Ouazar, D. (1999). Improved design of Anytown distribution network using structured messy genetic algorithms. Urban Water, 1, 23-38.
- Murphy, L. J., Dandy, G. C., and Simpson, A. R. (1994). Optimum design and operation of pumped water distribution systems. Proceedings of the Conference on Hydraulics in Civil Engineering, Brisbane, Australia:Institution of Engineers, Australia, 149-155.
- Farmani R., Walters G.A. and Savic D.A. (2005) Trade-off between total cost and reliability for Anytown water distribution network, ASCE journal of water resources planning and management, Vol. 131, No.3, pp.161-171.
- Farmani R., Walters G.A. and Savic D.A. (2006) Evolutionary multi-objective optimization of the design and operation of water distribution network:total cost vs. reliability vs. water quality, Journal of Hydroinformatics (in press)
- Farmani R., Savic D.A. and Walters G.A. (2005) Fuzzy rules for hydraulic reliability-based design and operation of water distribution systems. ASCE conference, EWRI 2005, Anchorage, Alaska, on CD-Rom.
- Farmani R., Walters G.A. and Savic D.A. (2004) The Simultaneous Optimization of Anytown Pipe Rehabilitation, Tank Sizing, Tank Siting and Pump Operation Schedules. ASCE conference. USA, On CD-Rom
- Farmani R., Walters G.A. and Savic D.A. (2004) Multi-objective optimization of cost, reliability and water quality of Anytown system in relation to dual objective optimization, Modelling and Control for Participatory Planning and Managing Water Systems Conference, Italy, on CD-Rom.
- Vamvakeridou-Lyroudia, L.S., Walters, G.A. and Savic D.A., (2005). “Fuzzy multiobjective design optimisation of water distribution networksâ€, Jour. Wat. Res, Plan. Man., ASCE, 131(6), pp. 467-476.
- Vamvakeridou-Lyroudia, L.S., Savic D.A. and Walters, G.A. (2006). “Fuzzy hierarchical decision support system for water distribution network optimisationâ€, Civil Eng. and Env. Systems, (accepted for publication).
- Vamvakeridou-Lyroudia, L.S., Walters, G.A. and Savic D.A. (2004). “Fuzzy multiobjective design optimisation of water distribution networksâ€, Report No.2004/01, Centre for Water Systems, School of Engineering, Computer Science and Mathematics, University of Exeter, Exeter, U.K., 98p.
Layout of new water distribution systems
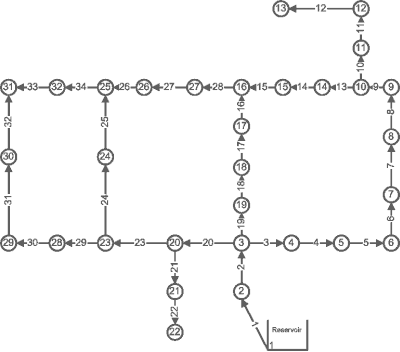
The Hanoi water distribution network has 32 nodes and 34 pipes organized in 3 loops. No pumping facilities are considered since only a single fixed head source at elevation of 100 m is available. The minimum head requirement at all nodes is fixed at 30 m. The set of commercially available diameters is [12, 16, 20, 24, 30, 40 inches].
The cost function is non-linear,

where
C is cost in dollars,
D is diameter in inches,
and L is length in metres.
The input file of the network is available in Epanet network solver format.
Operation
The file Richmond_standard is an input file for the Epanet hydraulic network analysis software (1). It contains a general, though not updated, description of the Richmond water distribution system, owned by Yorkshire Water in the UK. It was used in a PhD research project on operational optimization of water distribution systems by Kobus van Zyl (2,3) at the University of Exeter in 2001.
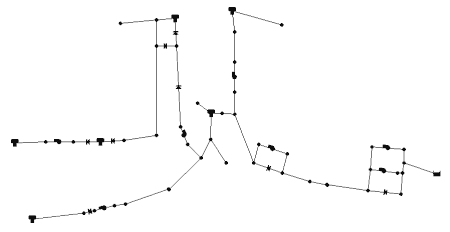
The file Richmond_skeleton . is an input file for the Epanet hydraulic network analysis software (1). It contains a schematic representation of the Richmond water distribution system, but is NOT an equivalent hydraulic model. It can be used to test a procedure (e.g. optimization) before moving on to the full Richmond system.
Yorkshire Water gave permission for the Richmond model to be used in academic studies, but in return would like to be kept informed about how it's being used and to see any outputs/papers. Researchers may contact Yorkshire Water through Mark Randall-Smith ( mark.randall-smith@ewan.co.uk). Kobus van Zyl can be contacted at ( jevz@ing.rau.ac.za orkobusvanzyl@mail.com).
System Description
Notes on previous operational optimisation study on richmond system
- The primary objective of the optimization was to determine the optimum trigger levels that would minimize the annual pumping costs over the whole system. Two pairs of trigger-on and trigger-off levels were used for each level control pump, one for off-peak, and the other for peak electricity tariff periods.
- The operational costs listed in (2) and (3) include energy and pump switch penalty costs. The best operational cost found (run 4 excluding penalty costs) was £33 982.
- A pump switch penalty cost of £0.15 per switch (on or off) was used.
- Only solutions where the levels in all service reservoirs at the end of the simulation run equals or exceed the levels at the start of the run were allowed.
- Minimum tank water levels were fixed at the following:
| Tank | Min Cntrl Level (m) |
|---|---|
| A | 1.02 |
| B | 2.03 |
| C | 0.50 |
| D | 1.10 |
| E | 0.20 |
| F | 0.19 |
- For easy reference, tanks were named using letters of the alphabet. Pumps were named by a number and the tank that controls their operation. For example, tank 3A is controlled by the level in tank A.
- The following tariffs were used for the pumps in the system:
| Pump | Off Peak (£/kWh) | Peak (£/kWh) |
|---|---|---|
| 1A | 0.02410 | 0.0679 |
| 2A | 0.02410 | 0.0679 |
| 3A | 0.02410 | 0.0754 |
| 4B | 0.02460 | 0.1234 |
| 5C | 0.02460 | 0.0987 |
| 6D | 0.02460 | 0.1120 |
| 7F | 0.02440 | 0.1194 |
-
Peak period was from 7:00 to 24:00.
-
Epanet uses slightly different procedures to determine intermediate time steps in the Epanet Programmers Toolkit and the stand-alone Epanet program. A network simulated on these two programmes will thus not necessarily produce identical results.
Configuration

Richmond Standard
Richmond Skeletonised
References
- Rossman, L. (1993). EPANET users manual.EPA-600/R-94/057, Environmental Protection Agency, Risk Recuction Engineering Laboratory, Cincinnati.
- Van Zyl, J.E. (2001). A methodology for improved operational optimization of water distribution systems, Ph.D. thesis, University of Exeter, UK.
- Van Zyl, J.E., Savic, D.A., Walters, G.A. (2004). Operational Optimization of Water Distribution Systems Using a Hybrid Genetic Algorithm, Journal of Water Resources Planning and Management, ASCE, 130 (3), 160-170.
Two-Objective Design/Resilience
For information on this, please see our dedicated webpage which presents the best-known Pareto fronts of twelve benchmark design problems of Water Distribution Systems.
