Email us

“I’ve gotta see through this”
Author: Dr Alexander R. May – TEAM-A Research Fellow on secondment to QinetiQ Plc.
This piece is linked to TEAM-A's 4th Research Challenge.
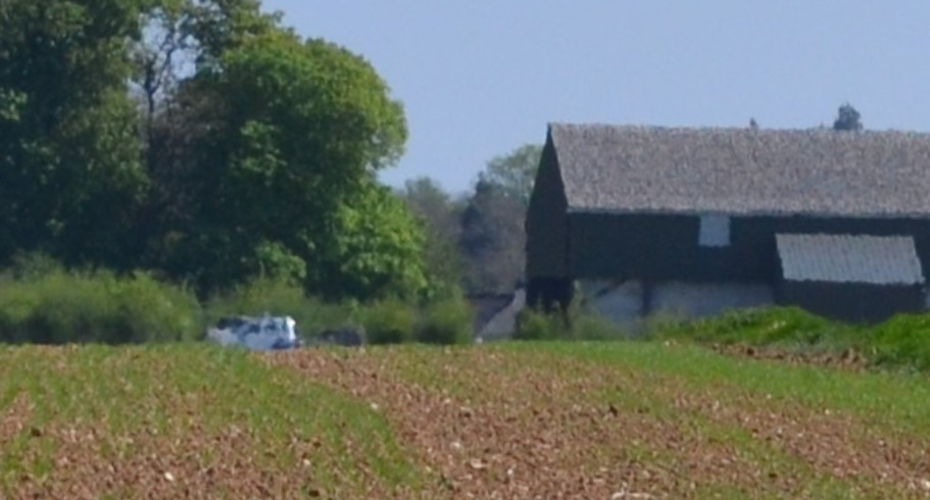
Anyone who has driven down a long road or looked across a field on a hot British summer day (see Figure 1) that what would usually appear as a clean-cut image of a road, building or car, can quickly become ‘blurred’ with that many would describe as ‘heat haze’ or shimmer.
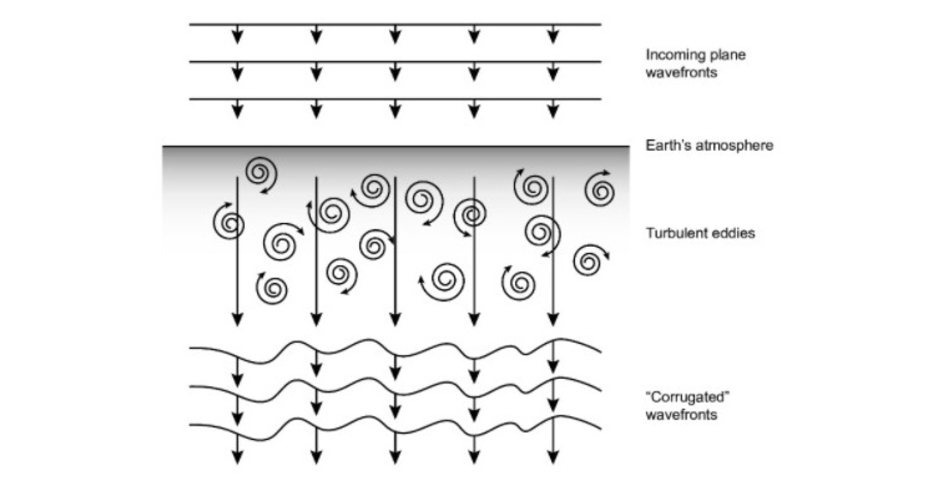
Turbulent ‘eddies’ of air above the hot ground cause the wavefronts of light emitted by the distant object to distorted on their path to the observer. This effect impacts significantly upon imaging techniques that are used for the characterisation of the atmosphere [1], monitoring levels of ground-level pollution [2], and even some novel forms of free-space optical communication used both between satellites and from a satellite to the ground [3]. It is, therefore, essential that methods of mitigation are put into place, which requires an understanding of the physical mechanisms at work.
An understanding of the physical mechanisms behind this distortion, was, like many pieces of work, pioneered under contract by the United States military in the 1970s. There was considerable and urgent interest during the cold-war on the ability of DARPA (Defense Advanced Research Project Agency) to target laser beams on any incoming enemy weapons correctly. Increased suspicion over the large number of new satellites being put into orbit by the-then USSR, and the ability to take clear ground-based photographs of them for identification purposes, gained a momentum of its own. At that time, rudimentary digital signal processing techniques did exist, but even after applying them to the ‘blurred’ photographs, the images were still too distorted to be useful [4]. A team of scientists at Litton Itek Optical Systems shortly afterwards won a contract to ‘undo’ the effects of turbulence and so Adaptive Optics (AO) as it would be known, was born.
The theoretical underpinning of the propagation of light through turbulent eddies was reviewed in depth by Strohbehn (citing 59 references!) in 1968 [5] and referred to shortly afterwards in a US Army report involving some experimental verification, and testing of the three classes of physical effects upon a free-space path of a laser beam – (i) beam wander, (ii) diameter variation and (iii) scintillation.
As is depicted in Figure 2, an incoming ‘plane’ optical wavefront comes into contact with the turbulent fluctuations in refractive index contained within the atmosphere, and the wavefront exits having become disturbed and ‘wavy’ [7]. The physics of the turbulent eddies of air was established earlier within the discipline of fluid dynamics by prominent mathematicians such as Batchelor [8], and it was deduced, at least approximately, that they were random features, with statistical properties that were independent of the direction of view (isotropic) and where within the turbulence you are located (homogeneous).
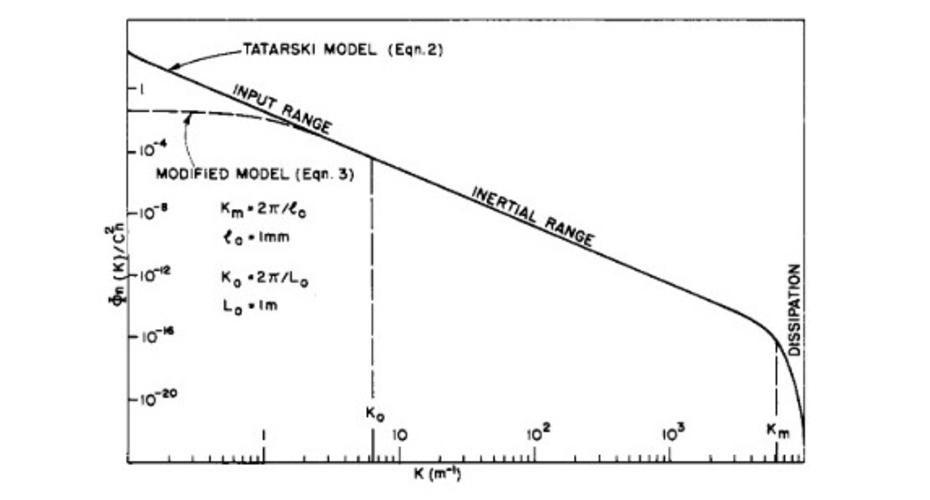
The turbulent eddies initially form when pockets of air gain energy from convective heating above the ground, as well as through wind shear. If a ‘blob’ of turbulence is in some sense a given size l, then it is possible to define the energy that exists in such a blob, Φv(k), where as a tool we define the ‘wavenumber’ k=2p/l. It can be shown mathematically that if the turbulence has eddies of a maximum size of, say, L0 (the outer scale, typically of the order of 100 metres or so) and a minimum size of l0 (the inner scale, typically around 10mm) then the energy of the eddies within these two regions (the inertial range) follows a universal law of the form, Φ(k)αk-11/3. This is represented by the straight line in Figure 3, which shows a ‘waterfall’ or cascade of energy from the large scale features to the small scale ones, with the smallest eddies eventually decaying and dissipating because of the viscosity (or stickiness) of the air itself. The eccentric Renaissance man Richardson [9], who had trained originally as a psychologist (!), affectionally described this whole process in verse,
“Big whirls have little whirls
that feed on their velocity,
and little whirls have lesser whirls
and so on to viscosity
– in the molecular sense”
Returning to the mechanisms by which the turbulent air modifies the light itself, it was extremely convenient that around the same time that the United States was investigating this problem, a translation of a monograph on the propagation of waves, in general, through random media by the Russian, Tatarski [10], became available to all. Tatarski had shown that the impact of the spontaneous movements of turbulent air on electromagnetic waves obeys a very similar statistical law to that of the eddy velocities described above and can be written approximately as, Φ(k)=0.033 Cn2 k-11/3 exp(-k2/km) [10], with the terms defined in Figure 3. With this realisation, the Russian Obukhov [11] developed an approximate mathematical description of how light is distorted in this process (now known as the Rytov model), which the Americans immediately investigated through a contract with the RAND Corporation. Fundamentally, Obukhovhad made a variety of approximations which allowed an observer to predict what they might see.
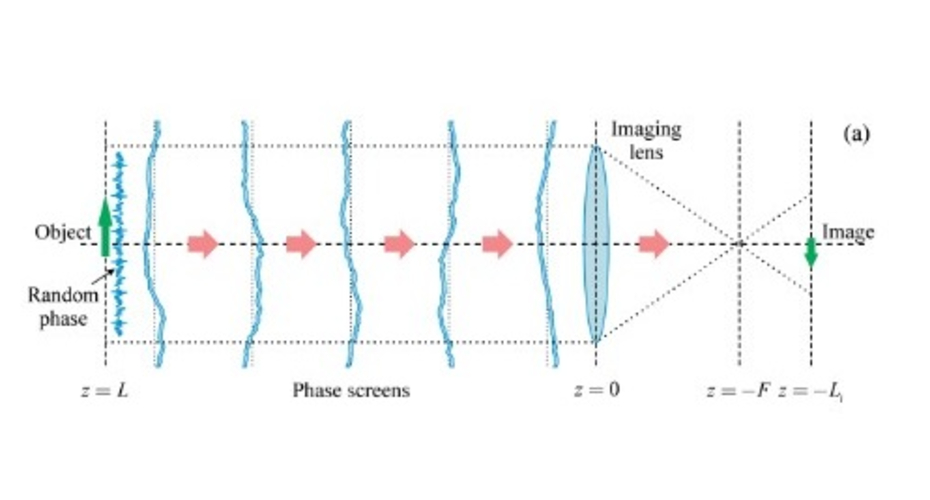
In many cases the interest, now, isn’t so much in predicting what a laser beam might look like on a target, but how a path of turbulent air might affect an extended-object or scene, such as that shown in Figure 1. The key to understanding this is to assume that the object is composed of an extensive number of points in space, each one emitting a little spherical wave of light (think of dropping a stone in a pond!). The observer then sees the collective interference (adding up) of all of these little spheres of light on arrival, leading to the resulting image.
Turbulent air affects each of these little spherical waves of light through both ‘lensing’ (the big eddies) and ‘diffracting’ (the smaller eddies) them, and the process is illustrated in Figure 4. The object located on the left-hand side is to be observed on the right, and the distorted wavefronts (the blue vertical lines) are the result of the summation of all of these little spheres of light.
The question remains as to how this “adding” of individual light waves can be further understood, and the answer comes from a topic in physics known as “coherence theory”.
In the year 1865, a French physicst by the name of E. Verdet, had pondered the recently proposed wavelike nature of light and wondered how close two pinholes might need to be in an opaque screen as to allow sunlight to form interference patterns when observed by a viewer. Little happened on this topic until 1939 when the mathematically and experimentally blessed physicist Fritz Zernike [13] derived a theorem or law that related how the level of interference and/or variable coherence (a new “daring” idea according to him at the time!) changed as it travelled through space. This whole concept is somewhat more easily understood by watching a video of ducks [14] (yes, really!), and reading the associated article [15].
However, without getting too stuck into the mathematical details, it happens that the coherence of light when observed at the lens can be written as the product of that predicted without any turbulence (no atmosphere!) and that due to properties of the turbulence itself. In physical terms, the image spectrum I(f) (spectrum being synonymous here with the relative power of different levels of detail in the image) may be written in terms of the object spectrum O(f), the ‘filtering’ effect of free-space diffraction (natural bending of light) and the statistics Gs() of the turbulence,
I(f)=O(f)G_s (Ld_i f)H_0 (f)
Following a bit of mathematical manipulation, it is possible to rewrite this equation in the form,
I(f)=O(f)H_LE (f)H_0 (f)
The HLE(f) term, now known as the long-exposure ‘filter’ function, was derived in the 1960s by D. L. Fried [16] while working for a previous incarnation of Boeing in the United States (needs must, and all that?). The filtering effect of the turbulence is then dependent upon its strength (remember Cn2 earlier?), the distance between the object and its observer, the focal length of the lens, and the wavelength of light. It should be noted that we are explicitly ignoring the effects of beam-wander (the image moving side to side) that can also occur in the case of short-exposure ‘snapshots’.
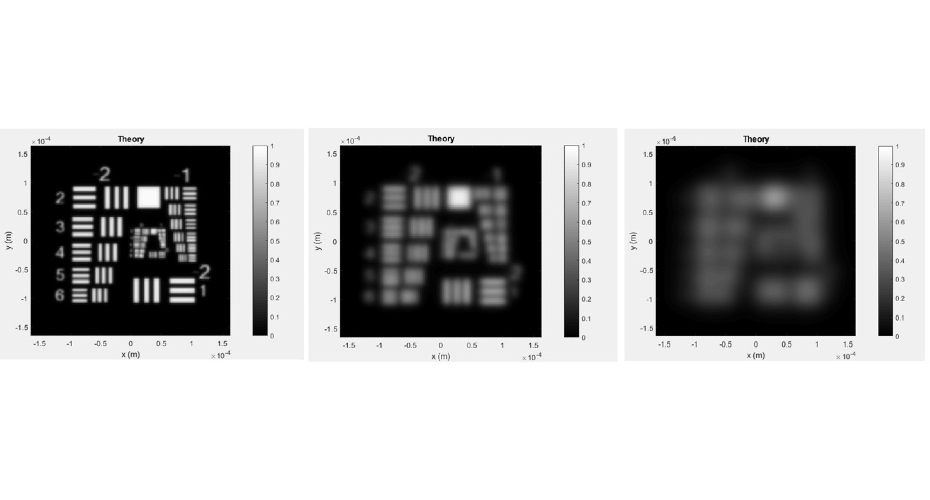
In practical terms, we can now demonstrate the effect of increasing levels of atmospheric turbulence on the image of a US Air Force official test pattern in Figure 5, predicted using a computer model developed as part of the TEAM-A Research Challenge 4 at QinetiQ. It makes sense that as the level of turbulence increases, top left to right, the level of “blurring” increases, and the ability to pick out the finer details becomes more difficult. As the level of turbulence is increased to that applied in the bottom image, it becomes almost impossible to decipher any element at all.
The purpose of this particular test pattern is to allow a viewer to determine what level of details can be seen at a given distance from an object. If you look closely there are sets of squares of varying ‘fine detail’ and the level of detail is then known by the observer beforehand.
The description of the work above is a significantly condensed and ‘popular-science’ review of one strand of the work that is currently being undertaken by TEAM-A Research Challenge 4 based in industry at QinetiQ. In addition to the simulated images above, there is considerable work underway to understand in more detail the physics involved in imaging through turbulent media, and the development and experimental validation of novel computer tools is underway. Such packages could assist in training other tools designed to mitigate such effects. It should be noted that one of the key aims of the TEAM-A programme has been to develop the careers of academic research staff and encourage collaboration with industry to solve real-world problems. This collaboration is now leading to innovation that will be of benefit to both communities.
[1] W. G. Rees, Physical principles of remote sensing. 1990.
[2] N. Hagen, “Sensitivity limits on optical gas imaging due to air turbulence,” Opt. Eng., vol. 57, no. 11, p. 1, Nov. 2018.
[3] NASA, “Laser Communications Relay Demonstration (LCRD),” 2013. [Online]. Available: http://www.nasa.gov/mission_pages/tdm/lcrd/lcrd_overview.html.
[4] J. Hardy, “Adaptive Optics,” Scientific American, vol. 270, no. 6, pp. 60–65, 1994.
[5] J. W. Strohbehn, “Line-of-Sight Wave Propagation Through the Turbulent Atmosphere,” Proc. IEEE, vol. 56, no. 8, pp. 1301–1318, 1968.
[6] P. M. Livingston, P. H. Deitz, and E. C. Alcaraz, “Light Propagation through a Turbulent Atmosphere: Measurements of the Optical-Filter Function*,” J. Opt. Soc. Am., vol. 60, no. 7, p. 925, 1970.
[7] D. F. Buscher and M. Longair, Practical Optical Interferometry. Cambridge: Cambridge University Press, 2015.
[8] G. Batchelor, The Theory of Homogeneous Turbulence. Cambridge, UK: Cambridge University Press, 1953.
[9] A. Vulpiani, “Lewis Fry Richardson: scientist, visionary and pacifist,” Lett. Mat., vol. 2, no. 3, pp. 121–128, 2014.
[10] V. I. Tatarski, Wave Propagation in a Turbulent Medium. New York: McGraw-Hill, 1961.
[11] A. Obukhov, “The influence of weak atmospheric inhomogeneities upon the propagation of sound and light (translation),” Santa Monica, California, USA, 1955.
[12] S. L. Lachinova, M. A. Vorontsov, G. A. Filimonov, D. A. LeMaster, and M. E. Trippel, “Comparative analysis of numerical simulation techniques for incoherent imaging of extended objects through atmospheric turbulence,” Opt. Eng., vol. 56, no. 7, p. 071509, 2017.
[13] F. Zernike, “Diffraction and Optical Image Formation,” Proc. Phys. Soc., vol. 61, no. 2, pp. 158–164, Aug. 1948.
[14] W. Knox, “Thirteen Rouen Ducks Create Coherent Waves,” 2009. [Online]. Available: https://youtu.be/4o48J4streE.
[15] W. H. Knox, M. Alonso, and E. Wolf, “Spatial coherence from ducks,” Phys. Today, vol. 63, no. 3, pp. 11–11, 2010.
[16] D. L. Fried, “Optical Resolution Through a Randomly Inhomogeneous Medium for Very Long and Very Short Exposures,” J. Opt. Soc. Am., vol. 56, no. 10, p. 1372, 1966.

